Dashboard
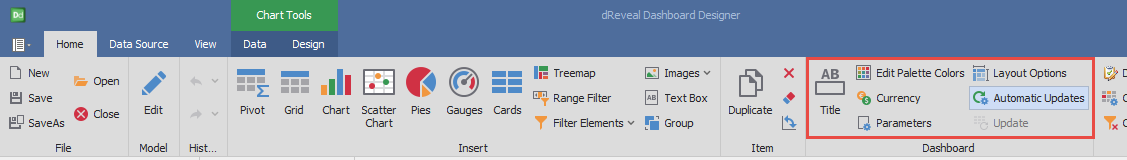
Dashboard Designer allows the user to perform functions such as Title, Edit Palette Colors, Currency, Layout Options, Automatic Updates and Update. With these functions, users can precisely tailor their reports to their needs.
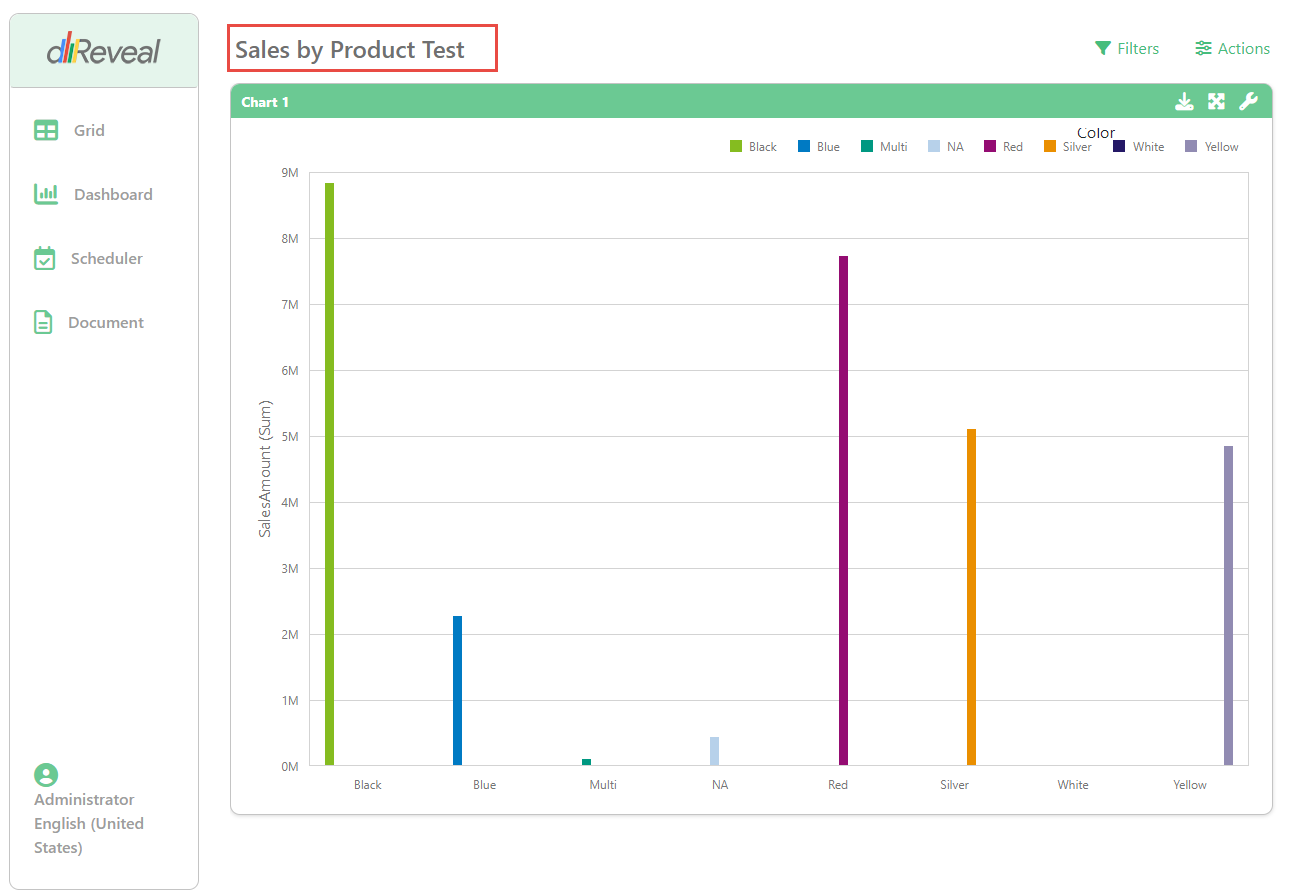
Title
This function allows the user to assign a customized title to each report. This not only facilitates identification and organization, but also enables users to convey the desired narrative for their data.
Steps to Rename the Report:
- Open Dashboard Designer.
- Create a new report or open an existing one.
- Click on the "Title" icon.
- Enter a title to the report.
- Click on the "Apply" button and click on the "Ok" button.
- Save changes.
- Upload the report to the web.
- Run the report.
Edit Palette Colors
This function allows the user to modify the color palette used in the charts and visualizations within the dashboard. By editing the color palette, users can select colors that match their brand's aesthetic, enhance the readability of the charts, or highlight important information.
Steps to Edit Palette Colors:
- Open Dashboard Designer.
- Create a new report or open an existing one.
- Click on the "Edit Palette Colors" icon.
- Select a new color.
- Click on the "OK" buton.
Currency
This function allows the user to display numerical values with the corresponding currency symbol, followed by the numerical value in the local currency format or selected by the user.
Steps to select a Currency in the Dashboard:
- Open Dashboard Designer.
- Create a new report or open an existing one.
- Click on the "Currency" icon.
- Select a "Currency".
- Click on the "OK" buton.
Layout Options
This function refers to the settings that allow the user to adjust the layout and arrangement of the chart within the available space in the report or dashboard.
Steps to Change the Layout Options:
- Open Dashboard Designer.
- Create a new report or open an existing one.
- Click on the "Layout Options" icon.
- Select "Fixed" option of "Width".
- Change the size.
- Click on the "Apply" button and click on the "Ok" button.
Automatic Updates
When this function is activated, it has the ability to automatically update data and charts in real-time while the user continues to create the report, ensuring that the reports always reflect the most up-to-date and relevant information available.
Steps to Automatic Update in the Dashboard:
- Open Dashboard Designer.
- Create a new report or open an existing one.
- Keep the "Automatic Updates" option selected.
- Add a new chart.
Update
When the 'Automatic Updates' function is not activated, the user has the option 'Update' to update the data and graphs in the report. The 'Update' option does not automatically update the data and graphs while the user is making changes in the report; the user must click on this option for the report to be updated.
Steps to Update in the Dashboard:
- Open Dashboard Designer.
- Create a new report or open an existing one.
- Do not keep the "Automatic updates" option selected.
- Add a new chart.
- Click on the "Update" icon.